Crypto Grid 2025+ Long Only (Asym TP)Crypto Grid 2025+ Long Only (Asymmetric Take-Profit) is a long-only mean-reversion grid strategy designed for intraday cryptocurrency trading.
The core idea is to accumulate long positions as price moves downward within a locally defined price range and to exit positions on upward retracements.
The strategy automatically builds a multi-level grid between the highest and lowest price over a user-defined lookback period (“range length”). Each grid level acts as a potential entry point when price crosses it from above.
Key Features
1. Long-only grid logic
The strategy opens long positions only, progressively increasing exposure as price moves into lower grid levels.
2. Asymmetric take-profit mechanism
Instead of taking profit strictly at the next grid level, the strategy allows targeting multiple levels above the entry point. This increases the average profit per winning trade and shifts the reward-to-risk profile toward larger, less frequent wins.
3. Optional partial take-profit
A portion of each trade can be closed at the nearest grid level, while the remainder is held for a more distant asymmetric target. This balances consistency and profit potential.
4. Volume-based market filter
Entries can be restricted to periods of healthy market activity by requiring volume to exceed a moving-average baseline.
5. Capital-scaled position sizing
Position size is determined by risk percentage, grid spacing, and a dynamic sizing mode (original / conservative / aggressive).
6. Built-in risk controls
global stop below the lower boundary of the range,
global take-profit above the upper boundary,
automatic shutdown after a configurable loss-streak.
Market Philosophy
This strategy belongs to the mean-reversion family: it expects short-term overshoots to revert back toward mid-range liquidity zones.
It is not trend-following.
It performs best in choppy, range-bound, or slow-grinding markets — especially on liquid crypto pairs.
Recommended Use Cases
Short timeframes (1–15 minutes)
High-liquidity crypto pairs
Sideways or rotational price action
Exchanges with low fees (due to higher order count)
Not Intended For
Strong trending markets without pullbacks
Assets with thin order books
Use with leverage without additional risk controls
Summary
Crypto Grid 2025+ Long Only (Asymmetric TP) is a refined grid-based mean-reversion strategy optimized for modern crypto markets. Its asymmetric take-profit framework is specifically engineered to reduce the classical issue of “small wins and large occasional losses” found in traditional grid systems, giving it a more favorable long-term trade distribution.
Cari skrip untuk "take profit"

EMA Trend Pro v5.0 5M ONLY — 策略版(1:1出30%+保本)Here is a clear, professional English description you can copy-paste directly (suitable for sharing with friends, investors, brokers, or posting on TradingView):
EMA Trend Pro v5.0 – Strategy Overview
This is a trend-following strategy designed for 15-minute charts on assets like XAUUSD, NASDAQ, BTC, and ETH.
Entry Rules
Buy when the 7, 14, and 21-period EMAs are aligned upward and the 14-period EMA crosses above the 144-period EMA (with ADX > 20 and volume confirmation).
Sell short when the EMAs are aligned downward and the 14-period EMA crosses below the 144-period EMA.
Risk Management
Initial stop-loss is placed at 1.8 × ATR below (long) or above (short) the entry price.
Position size is calculated to risk a fixed percentage of equity per trade.
Profit-Taking & Trade Management
When price reaches 1:1 reward-to-risk, 30% of the position is closed.
At the same moment, the stop-loss for the remaining 70% is moved to the entry price (breakeven).
The remaining position is split:
50% targets 1:2 reward-to-risk
50% targets 1:3 reward-to-risk (allowing big wins during strong trends)
Visualization
Clean colored bars extend to the right showing entry, stop-loss, and three take-profit levels.
Price labels clearly display "Entry", "SL", "TP1 1:1", "TP2 1:2", and "TP3 1:3".
Only the current trade is displayed for a clean chart.
Key Advantages
High win rate due to breakeven protection after 1R
Excellent reward-to-risk ratio that lets winners run
Fully automated, works on any market with clear trends
Professional look, easy to understand and explain
Perfect for swing traders who want consistent profits with limited downside risk.
Feel free to use this description on TradingView, in your trading journal, or when explaining the strategy to others!
If you want a shorter version (e.g., for TradingView description box) or a Chinese version, just let me know — I’ll give it to you right away! 😊

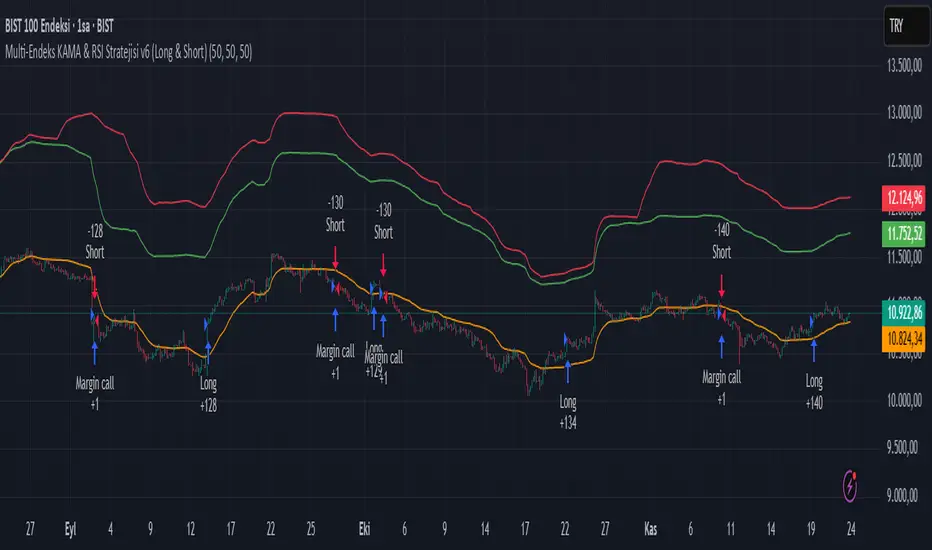
Multi-Endeks KAMA & RSI Stratejisi v6 (Long & Short)Multi-Index KAMA & RSI Strategy v6 (Long & Short)
This is a hybrid trading strategy that combines two powerful technical analysis tools—the Kaufman's Adaptive Moving Average (KAMA) for trend following and the Relative Strength Index (RSI) for measuring momentum and identifying overbought/oversold conditions.
The term "Multi-Index" suggests that the decision-making process might incorporate data or conditions from several different market indices or timeframes, rather than just the single asset being traded.
🧭 Core Components
1. KAMA (Kaufman's Adaptive Moving Average)
KAMA is an adaptive moving average developed by quantitative financial theorist Perry J. Kaufman.
Adaptivity: Unlike standard moving averages, KAMA automatically adjusts its smoothing factor (speed) based on market volatility.
Mechanism:
Trending Markets (Low Noise): When prices move clearly in one direction (low volatility), KAMA speeds up, hugging the price closely and providing fast signals.
Sideways Markets (High Noise): When prices are choppy (high volatility/noise), KAMA slows down, smoothing out price fluctuations to reduce the risk of whipsaws (false signals).
Role in Strategy: To define the main trend direction. The position of the price relative to the KAMA line determines the base directional bias (Long or Short).
2. RSI (Relative Strength Index)
RSI is a momentum oscillator developed by J. Welles Wilder Jr. that measures the speed and change of price movements.
Overbought/Oversold: It oscillates between 0 and 100. Conventionally, a reading above 70 suggests overbought conditions (potential sell signal), and a reading below 30 suggests oversold conditions (potential buy signal).
Role in Strategy: Timing and Confirmation. Once the trend is confirmed by KAMA, the RSI acts as a timing filter, often confirming an entry as it moves away from extreme overbought (for Short) or oversold (for Long) levels.
📉 Potential Trading Logic (V6)
This "v6" strategy likely aims to capture more reliable entries by requiring both trend (KAMA) and momentum (RSI) alignment:
1. LONG (Buy) Entry Conditions
Trend Confirmation (KAMA): The asset's price (Closing Price) must be above the KAMA line (confirming an uptrend).
Momentum Confirmation (RSI):
Option A (Reversal): The RSI must cross above the 30 level (exiting oversold) or decisively move above the 50 level.
Option B (Trend-Continuation): In a strong uptrend, the RSI might bounce off the 40-50 zone and turn upwards, confirming trend continuation.
2. SHORT (Sell) Entry Conditions
Trend Confirmation (KAMA): The asset's price (Closing Price) must be below the KAMA line (confirming a downtrend).
Momentum Confirmation (RSI):
Option A (Reversal): The RSI must cross below the 70 level (exiting overbought) or decisively move below the 50 level.
Option B (Trend-Continuation): In a strong downtrend, the RSI might be rejected from the 50-60 zone and turn downwards, confirming continuation.
3. Exit Management
The strategy likely utilizes dynamic risk controls:
Stop-Loss: A dynamic stop placed on the opposite side of the KAMA, or an ATR-based distance to adjust to volatility.
Take-Profit: Conditions such as the RSI reaching extreme levels or the KAMA line being crossed in the reverse direction.
🌟 Implication of the "V6" Version
The "v6" designation implies that the strategy has been refined and iterated upon over time to address weaknesses in prior versions (v1, v2, etc.). These improvements might include:
Filters: Adding stricter RSI or KAMA cross filters to reduce false signals.
Multi-Index Logic: Using the RSI or KAMA of a secondary instrument (e.g., a major index or volatility measure) as a macro filter for the main trade execution.
Optimization: Optimizing the default lookback periods for KAMA and RSI for different asset classes.
CBS Strategy with Trailing Stop _ IK3-Candle High/Low Breakout Strategy – Clean, Powerful, Fully Customizable (Pine Script v6)
A simple yet effective momentum breakout strategy that triggers trades when price closes above the highest high or below the lowest low of the previous 3 completed candles.
Perfect for trending markets (stocks, forex, crypto, indices) on any timeframe.
Key Features:
• Pure price-action breakout logic (no repainting)
• Long & Short entries with visual triangle signals
• Built-in Stop Loss & Take Profit (fixed % or ATR-based)
• Optional Trailing Stop (percentage or ATR multiplier)
• All risk parameters fully adjustable from the settings panel
• Clean on-chart visualization of SL, TP, and active trailing stop levels
• Works on all instruments and timeframes
Default Settings (2:1 Reward/Risk):
• Stop Loss: 1.5%
• Take Profit: 3.0%
• Trailing Stop: 1.0% (optional)
How to Use:
1. Add to chart
2. Adjust risk settings to match your style (fixed % or ATR)
3. Enable/disable trailing stop as needed
4. Backtest and optimize per instrument/timeframe
Fully open-source • No external libraries • Pine Script v6
Great for swing trading, intraday breakouts, or as a base for further enhancements.
Happy trading!

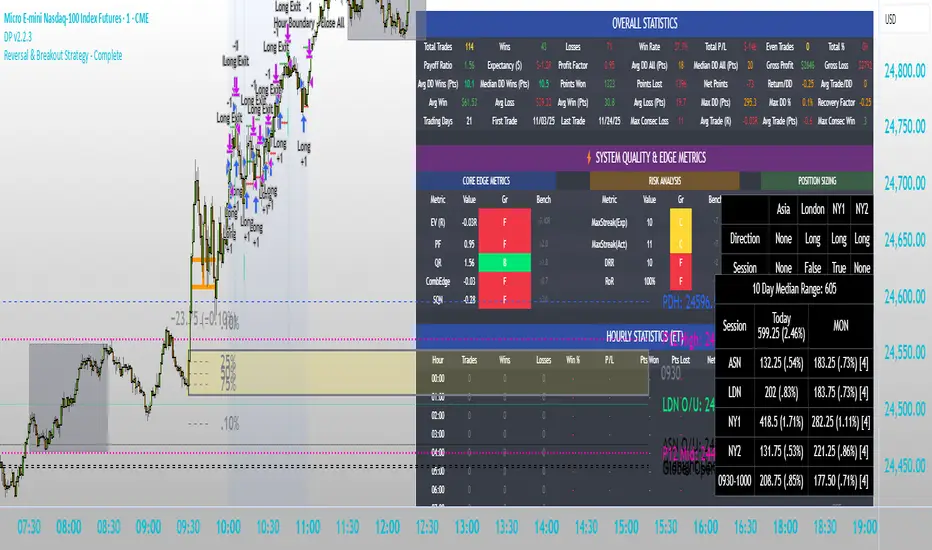
Intraday Market Structure Research Tool (Reversal + Breakout)This script is a fully rule-based intraday strategy designed for research and backtesting purposes, not financial advice. It is intended to help traders study market behavior, time-based price patterns, and statistical trade outcomes under realistic trading assumptions.
What the Strategy Does
This strategy operates in two selectable trade modes:
1. Reversal Mode
Identifies statistically large candles relative to recent volatility
Enters counter-direction trades when price shows exhaustion behavior
Designed to study fade-type behavior around session extremes
2. Breakout Mode
Tracks recent swing highs/lows over a user-defined lookback
Executes trades only after confirmed price expansion beyond these levels
Designed to test momentum continuation behavior
Time & Session Filtering
Trades are only taken during user-defined market sessions, including:
New York 1
New York 2
London
Asia
This allows users to analyze performance differences between global trading sessions.
9:30 AM Opening Range Logic
The script captures the 9:30 AM (Eastern) one-minute candle high/low and uses that as an Opening Range:
Breakout trades can be confirmed above or below this range
The range is visualized for clarity
Risk Management & Realism Controls
This script includes realistic execution mechanics:
Fixed stop-loss and take-profit defined by the user (points or ticks)
Built-in slippage modeling
Commission assumptions included
Position sizing designed to keep risk per trade under 5–10% of account equity when used with realistic account sizes
Users are responsible for choosing realistic account sizes and risk values when running backtests.
Statistical Performance Tracking
The strategy records and displays performance data including:
Win rate
Average win and loss
Maximum drawdown per trade series
Expectancy
Trade distribution by:
Time of day
Session
Market classification
This allows users to study market tendencies and structural behavior over large sample sizes.
Visual Tools
The script displays:
Entry and exit markers
Blocked trade labels (when conditions are not met)
Opening range box
Breakout levels
Use Case Disclaimer
This script is designed for:
Backtesting
Market structure research
Statistical study
It is not guaranteed to be profitable, and results depend heavily on user-selected settings, market conditions, and realistic brokerage assumptions.
Semi-Martingala Sicura 1.20x PROIncrements or a maximum amount of 200. If the previous trade is profitable, the count is reset and the initial amount is resumed. Exit management uses fixed percentage stop loss and take profit, set relative to the entry price. In summary, this strategy aims to capitalize on trend and momentum signals, using a semi-martingale system to increase positions in case of losses, but with precise limits to contain risk. Note: This method aims to be "safer" than a classic martingale, respecting increment limits and a maximum amount.
Comment by saying what you think and what I could change.

MSB Trend Breakout Strategy V7**MSB Trend Breakout Strategy V7**
This is the full, high-precision automated strategy designed for disciplined traders who understand directional price action. The script functions as a robust **entry and trade management tool** following two proprietary concepts:
**1. Trend Confirmation:** A customized Moving Average filter is utilized to ensure entries strictly align with the dominant market flow.
**2. Momentum Confirmation:** The system uses a specific short-term **multi-bar breakout range** to pinpoint high-probability entries at the start of a momentum shift, avoiding choppy market conditions.
**Key Features:**
* **Automated Risk Management:** Includes complete dynamic Stop Loss (SL) and Take Profit (TP) order management to ensure capital preservation.
* **Time Filter:** Optimizes performance by filtering signals to the most liquid Forex trading hours (01:00 to 19:00, broker time).
**PREREQUISITE FOR ACCESS:**
This is an advanced tool. To utilize the strategy effectively, the user should have a foundational understanding of directional bias and trade management principles.
---
**Important Note & Risk Disclosure:**
This strategy is published under **Invite-only** protection. The script does not provide financial advice or guarantee profits. Past performance is not indicative of future results.

Range Trading StrategyOVERVIEW
The Range Trading Strategy is a systematic trading approach that identifies price ranges
from higher timeframe candles or trading sessions, tracks pivot points, and generates
trading signals when range extremes are mitigated and confirmed by pivot levels.
CORE CONCEPT
The strategy is based on the principle that when a candle (or session) closes within the
range of the previous candle (or session), that previous candle becomes a "range" with
identifiable high and low extremes. When price breaks through these extremes, it creates
trading opportunities that are confirmed by pivot levels.
RANGE DETECTION MODES
1. HTF (Higher Timeframe) Mode:
Automatically selects a higher timeframe based on the current chart timeframe
Uses request.security() to fetch HTF candle data
Range is created when an HTF candle closes within the previous HTF candle's range
The previous HTF candle's high and low become the range extremes
2. Sessions Mode:
- Divides the trading day into 4 sessions (UTC):
* Session 1: 00:00 - 06:00 (6 hours)
* Session 2: 06:00 - 12:00 (6 hours)
* Session 3: 12:00 - 20:00 (8 hours)
* Session 4: 20:00 - 00:00 (4 hours, spans midnight)
- Tracks high, low, and close for each session
- Range is created when a session closes within the previous session's range
- The previous session's high and low become the range extremes
PIVOT DETECTION
Pivots are detected based on candle color changes (bullish/bearish transitions):
1. Pivot Low:
Created when a bullish candle appears after a bearish candle
Pivot low = minimum of the current candle's low and previous candle's low
The pivot bar is the actual bar where the low was formed (current or previous bar)
2. Pivot High:
Created when a bearish candle appears after a bullish candle
Pivot high = maximum of the current candle's high and previous candle's high
The pivot bar is the actual bar where the high was formed (current or previous bar)
IMPORTANT: There is always only ONE active pivot high and ONE active pivot low at any
given time. When a new pivot is created, it replaces the previous one.
RANGE CREATION
A range is created when:
(HTF Mode) An HTF candle closes within the previous HTF candle's range AND a new HTF
candle has just started
(Sessions Mode) A session closes within the previous session's range AND a new session
has just started
Or Range Can Be Created when the Extreme of Another Range Gets Mitigated and We Have a Pivot low Just Above the Range Low or Pivot High just Below the Range High
Range Properties:
rangeHigh: The high extreme of the range
rangeLow: The low extreme of the range
highStartTime: The timestamp when the range high was actually formed (found by looping
backwards through bars)
lowStartTime: The timestamp when the range low was actually formed (found by looping
backwards through bars)
highMitigated / lowMitigated: Flags tracking whether each extreme has been broken
isSpecial: Flag indicating if this is a "special range" (see Special Ranges section)
RANGE MITIGATION
A range extreme is considered "mitigated" when price interacts with it:
High is mitigated when: high >= rangeHigh (any interaction at or above the level)
Low is mitigated when: low <= rangeLow (any interaction at or below the level)
Mitigation can happen:
At the moment of range creation (if price is already beyond the extreme)
At any point after range creation when price touches the extreme
SIGNAL GENERATION
1. Pending Signals:
When a range extreme is mitigated, a pending signal is created:
a) BEARISH Pending Signal:
- Triggered when: rangeHigh is mitigated
- Confirmation Level: Current pivotLow
- Signal is confirmed when: close < pivotLow
- Stop Loss: Current pivotHigh (at time of confirmation)
- Entry: Short position
Signal Confirmation
b) BULLISH Pending Signal:
- Triggered when: rangeLow is mitigated
- Confirmation Level: Current pivotHigh
- Signal is confirmed when: close > pivotHigh
- Stop Loss: Current pivotLow (at time of confirmation)
- Entry: Long position
IMPORTANT: There is only ever ONE pending bearish signal and ONE pending bullish signal
at any given time. When a new pending signal is created, it replaces the previous one
of the same type.
2. Signal Confirmation:
- Bearish: Confirmed when price closes below the pivot low (confirmation level)
- Bullish: Confirmed when price closes above the pivot high (confirmation level)
- Upon confirmation, a trade is entered immediately
- The confirmation line is drawn from the pivot bar to the confirmation bar
TRADE EXECUTION
When a signal is confirmed:
1. Position Management:
- Any existing position in the opposite direction is closed first
- Then the new position is entered
2. Stop Loss:
- Bearish (Short): Stop at pivotHigh
- Bullish (Long): Stop at pivotLow
3. Take Profit:
- Calculated using Risk:Reward Ratio (default 2:1)
- Risk = Distance from entry to stop loss
- Target = Entry ± (Risk × R:R Ratio)
- Can be disabled with "Stop Loss Only" toggle
4. Trade Comments:
- "Range Bear" for short trades
- "Range Bull" for long trades
SPECIAL RANGES
Special ranges are created when:
- A range high is mitigated AND the current pivotHigh is below the range high
- A range low is mitigated AND the current pivotLow is above the range low
In these cases:
- The pivot value is stored in an array (storedPivotHighs or storedPivotLows)
- A "special range" is created with only ONE extreme:
* If pivotHigh < rangeHigh: Creates a range with rangeHigh = pivotLow, rangeLow = na
* If pivotLow > rangeLow: Creates a range with rangeLow = pivotHigh, rangeHigh = na
- Special ranges can generate signals just like normal ranges
- If a special range is mitigated on the creation bar or the next bar, it is removed
entirely without generating signals (prevents false signals)
Special Ranges
REVERSE ON STOP LOSS
When enabled, if a stop loss is hit, the strategy automatically opens a trade in the
opposite direction:
1. Long Stop Loss Hit:
- Detects when: position_size > 0 AND position_size <= 0 AND low <= longStopLoss
- Action: Opens a SHORT position
- Stop Loss: Current pivotHigh
- Trade Comment: "Reverse on Stop"
2. Short Stop Loss Hit:
- Detects when: position_size < 0 AND position_size >= 0 AND high >= shortStopLoss
- Action: Opens a LONG position
- Stop Loss: Current pivotLow
- Trade Comment: "Reverse on Stop"
The reverse trade uses the same R:R ratio and respects the "Stop Loss Only" setting.
VISUAL ELEMENTS
1. Range Lines:
- Drawn from the time when the extreme was formed to the mitigation point (or current
time if not mitigated)
- High lines: Blue (or mitigated color if mitigated)
- Low lines: Red (or mitigated color if mitigated)
- Style: SOLID
- Width: 1
2. Confirmation Lines:
- Drawn when a signal is confirmed
- Extends from the pivot bar to the confirmation bar
- Bearish: Red, solid line
- Bullish: Green, solid line
- Width: 1
- Can be toggled on/off
STRATEGY SETTINGS
1. Range Detection Mode:
- HTF: Uses higher timeframe candles
- Sessions: Uses trading session boundaries
2. Auto HTF:
- Automatically selects HTF based on current chart timeframe
- Can be disabled to use manual HTF selection
3. Risk:Reward Ratio:
- Default: 2.0 (2:1)
- Minimum: 0.5
- Step: 0.5
4. Stop Loss Only:
- When enabled: Trades only have stop loss (no take profit)
- Trades close on stop loss or when opposite signal confirms
5. Reverse on Stop Loss:
- When enabled: Hitting a stop loss opens opposite trade with stop at opposing pivot
6. Max Ranges to Display:
- Limits the number of ranges kept in memory
- Oldest ranges are purged when limit is exceeded
KEY FEATURES
1. Dynamic Pivot Tracking:
- Pivots update on every candle color change
- Always maintains one high and one low pivot
2. Range Lifecycle:
- Ranges are created when price closes within previous range
- Ranges are tracked until mitigated
- Mitigation creates pending signals
- Signals are confirmed by pivot levels
3. Signal Priority:
- Only one pending signal of each type at a time
- New signals replace old ones
- Confirmation happens on close of bar
4. Position Management:
- Closes opposite positions before entering new trades
- Tracks stop loss levels for reverse functionality
- Respects pyramiding = 1 (only one position per direction)
5. Time-Based Drawing:
- Uses time coordinates instead of bar indices for line drawing
- Prevents "too far from current bar" errors
- Lines can extend to any historical point
USAGE NOTES
- Best suited for trending and ranging markets
- Works on any timeframe, but HTF mode adapts automatically
- Sessions mode is ideal for intraday trading
- Pivot detection requires clear candle color changes
- Range detection requires price to close within previous range
- Signals are generated on bar close, not intra-bar
The strategy combines range identification, pivot tracking, and signal confirmation to
create a systematic approach to trading breakouts and reversals based on price structure, past performance does not in any way predict future performance

Quantura - Quantified Price Action StrategyIntroduction
“Quantura – Quantified Price Action Strategy” is an invite-only Pine Script strategy designed to combine multiple price action concepts into a single trading framework. It integrates supply and demand zones, liquidity sweeps and runs, fair value gaps (FVGs), RSI filters, and EMA trend confirmation. The strategy also provides a visual overlay with dynamic trend-colored candles for easier chart interpretation. It is intended for multi-market use across cryptocurrencies, Forex, equities, and indices.
Originality & Value
The strategy is original in how it unifies several institutional-style price action elements and validates trades only when they align. This reduces noise compared to using single indicators in isolation. Its unique value lies in the combination of:
Supply & Demand detection: Dynamic boxes identified through pivots, ATR, and volume sensitivity.
Liquidity sweeps and runs: Detects when swing highs/lows are broken and retested, distinguishing between liquidity grabs (sweeps) and directional runs.
RSI filter: Can be set to normal or aggressive, confirming momentum before trades.
Fair Value Gaps (FVGs): Optional detection and filtering of price inefficiencies.
EMA filter: Aligns trades with the broader market trend.
Trend candle visualization: Candles dynamically colored bullish, bearish, or neutral, based on strategy positions.
This layered confluence approach ensures that entries are not taken on a single condition but require agreement across several dimensions of market structure, momentum, and order flow.
Functionality & Indicators
Supply & Demand Zones: Zones are created when pivots, ATR sensitivity, and volume thresholds overlap.
Liquidity: Swing highs and lows are tracked, with options for sweep (fakeout/reversal) or run (continuation) detection.
RSI: Confirms long signals when oversold and shorts when overbought, with configurable aggressiveness.
FVG filter: Adds validation by requiring price interaction with inefficiency zones.
EMA filter: Ensures longs are above EMA and shorts below EMA.
Signals & Visualization: Trade entries are marked on the chart, while candles change color to reflect trade direction and status.
Parameters & Customization
Supply & Demand: Sensitivity (swing range, volume multiplier, ATR multiplier) and display options.
Liquidity filter: Mode (Run or Sweep), display, and swing length.
RSI: Enable/disable, length, and style (normal or aggressive).
Fair Value Gaps: Sensitivity via ATR factor, optional volume filter, and display toggles.
EMA: Length, enable/disable, and visualization.
Risk management: Up to three configurable take-profit levels, stop-loss, break-even logic, and capital-based position sizing.
Visualization: Custom candle coloring and optional overlay for better clarity.
Default Properties (Strategy Settings)
Initial Capital: 10,000 USD
Position Size: 100% of equity per trade (backtest default)
Commission: 0.1%
Slippage: 1
Pyramiding: 0 (only one position at a time)
Note: The default of 100% equity per trade is used for testing purposes only and would not be sustainable in real trading. A typical allocation in practice would be between 1–5% of account equity per trade, sometimes up to 10%.
Backtesting & Performance
Backtests on XPTUSD over 2.5 years with the default settings produced:
164 trades
67.68% win rate
Profit factor: 1.7
Maximum drawdown: 27.81%
These results show how the confluence of supply/demand, liquidity, and RSI filters can produce robust setups. However, past performance does not guarantee future results. While the trade count (164) is sufficient for statistical analysis, results may vary across markets and timeframes.
Risk Management
Three configurable take-profit levels with percentage allocation.
Initial stop-loss based on user-defined percentage.
Dynamic stop-loss that adjusts with market movement.
Break-even logic that shifts stops to entry after predefined gains.
Position sizing based on risk percentage of equity.
This framework allows both conservative and aggressive configurations, depending on user preference.
Limitations & Market Conditions
Works best in volatile and liquid markets such as crypto, metals, indices, and FX.
May produce false signals in low-volume or sideways environments.
Unexpected news or macro events can override technical conditions.
Default position sizing of 100% equity is highly aggressive and should be reduced before any practical use.
Usage Guide
Add “Quantura – Quantified Price Action Strategy” to your chart.
Select Supply & Demand, Liquidity, RSI, EMA, and FVG settings according to your market and timeframe.
Configure risk management: take-profits, stop-loss, and risk-per-trade percentage.
Use the Strategy Tester to analyze statistics, equity curve, and performance under different conditions.
Optimize parameters before applying the strategy to different markets.
Author & Access
Developed 100% by Quantura. Published as an Invite-Only script.
Important
This description complies with TradingView’s publishing rules. It clarifies originality, explains the underlying logic, discloses default properties, and presents backtest results with realistic disclaimers.

ATR BuySideATR Buyside Strategy
This is a simple buy-only trading plan. It uses ATR (a tool to measure price swings) to spot when prices are rising strongly.
How it works:
Buy signal: Enter a long trade when the price moves above a moving support line (based on ATR)
Sell signals: Close if the trend turns down (quick market sell).
Stop loss: Follows the support line to protect gains.
Take profit: Sell at 2 times the recent price swing (for steady wins).
Settings you can change:
ATR period: 13 (how many days to look back).
Factor: 2.0 (makes the line wider or tighter).
Use Heikin Ashi: To Filter out Noise
Great for Opt premiums like NIFTY on 15min or 30m charts. Test it first—past results don't guarantee future wins. Not advice, just a tool!

TMB Invest - Smart Money Concept StrategyEnglish:
**Quick Overview**
The "TMB_SMC_Strategy_v1.1.3" combines a classic trend filter using two EMAs with contrarian RSI entries and simple SMC elements (Fair Value Gaps & Order Blocks). Stop-loss and take-profit orders are volatility-adaptive and controlled via the ATR. An integrated dashboard displays the setup status, stop-loss/take-profit levels, entry reference, and trend, RSI, and ATR values.
---
## Operating Principle
1. **Trend Filter:** A fast EMA (default 50) is compared to a slow EMA (default 200). Trading occurs only in the direction of the trend: long in uptrends, short in downtrends.
2. **Timing via RSI:** Contrarian entries within the trend. Go long when the RSI is below a buy level (default 40); Short when the RSI is above a sell level (standard 60).
3. **Structure Check (SMC Proxy):** An "FVG Touch" serves as additional confirmation that an inefficient price zone has been tested. Order blocks are visualized for guidance but are not a direct entry trigger.
4. **Risk Management via ATR:** Stop-loss and take-profit levels are set as multipliers of the current ATR (e.g., SL = 1×ATR, TP = 2×ATR). This allows target and risk distances to adjust to market volatility.
5. **Simple Position Logic:** Only one position is held at a time (no pyramiding). After entry, stop and limit orders (bracket exit) are automatically placed.
---
## Input Values
* **EMA Fast / EMA Slow:** Lengths of the moving averages for the trend filter.
* **RSI Length / Levels:** Length of the RSI as well as buy and sell thresholds (contra signals within the trend direction).
* **Take Profit (RR) / Stop Loss (RR):** ATR multipliers for TP and SL.
* **Show FVGs & Order Blocks:** Toggles the visual SMC elements (zones/boxes) on or off.
--
## Signals & Execution
* **Long Setup:** Uptrend (fast EMA above slow EMA) **and** RSI below the buy level **and** a current FVG signal in a bullish direction.
* **Short Setup:** Downtrend (fast EMA below slow EMA) **and** RSI above the sell level **and** a current FVG touch in a bearish direction.
* **Entry & Exit:** If the setup is met, the market is entered; stop-loss/take-profit orders are placed immediately according to ATR multiples.
--
## Visualization
* **EMAs:** The fast and slow EMAs are plotted to illustrate the trend.
* **FVGs:** Fair Value Gaps are drawn as semi-transparent boxes in the trend color and projected slightly into the future.
* **Order Blocks:** Potential order block zones from the previous candle are visually highlighted (for informational purposes only).
---
## Integrated Dashboard
A compact table dashboard (bottom left) displays:
* Current **Setup Status** (Long/Short active, Long/Short ready, No Setup),
* **Stop-Loss**, **Take-Profit**, and **Entry Reference**,
* **Trend Status** (Bull/Bear/Sideways),
* **RSI Value**, and **ATR Value**.
Active long/short positions are highlighted in color (green/red).
--
## Practical Guide
1. **Place on Chart** and select the desired timeframe.
2. **Calibrate Parameters** (EMA lengths, RSI levels, ATR multipliers) to match the market and timeframe.
3. **Backtest** across different market phases; prioritize robustness over maximum curve fit.
4. **Fine-Tuning:**
* Shorter EMAs are often useful intraday (e.g., 20/100 or 34/144).
* Adjust RSI levels to market characteristics (45/55 for aggressive trading, 30/70 for conservative trading).
* Increase or decrease ATR multipliers depending on volatility/trading style.
--
## Notes, Limitations & Extensions
* **FVG Definition:** The FVG detection used here is intentionally simplified. Those who prefer a more rigorous approach can switch to a 3-candle definition and fill levels.
* **Order Blocks:** These primarily serve as a guide. Integration into entry/exit logic (e.g., retests) is possible as an extension.
* **Backtest Realism:** Fills may differ from the displayed closing price. For greater accuracy, intrabar backtests or an entry indicator based on the average position price are conceivable.
* **Alerts:** Currently, no alert conditions are defined; these can be added for long/short setups and status messages.
* **Position Management:** By default, no scaling is performed. Partial sales, trailing stops, or multiple entries can be added.
---
## Purpose & Benefits
The strategy offers a clear, modular framework: trend filter (direction), RSI contra timing (entry), SMC proxy via FVG Touch (structure), and ATR-based exits (risk adaptation). This makes it robust, easy to understand, and highly extensible—both for discretionary traders who appreciate visual SMC elements and for systematic testers who prefer a clean, parameterizable foundation.

Tristan's Multi-Indicator Reversal StrategyMulti-Indicator Reversal Strategy - Buy Low, Sell High
A comprehensive reversal detection system that combines multiple proven technical indicators to identify high-probability entry points for catching reversals at market extremes.
📊 Strategy Overview
This strategy is designed for traders who want to buy at lows and sell at highs by detecting when stocks are overextended and ready to reverse. It works by requiring multiple technical indicators to align before generating a signal, significantly reducing false entries.
Best Used On:
Timeframe: 1-hour charts (also works on 15min, 30min, 4hour)
Session: NY Trading Session (9:30 AM - 4:00 PM ET)
Assets: Stocks, ETFs, Crypto (particularly volatile tech stocks like ZM, TSLA, AAPL)
Trading Style: Swing trading, Intraday reversals
🔧 Technical Components
The strategy combines FIVE powerful technical indicators:
1. RSI (Relative Strength Index)
2. MACD (Moving Average Convergence Divergence)
3. Williams %R
4. Bollinger Bands
5. Volume Analysis
6. Divergence Detection (Optional)
🎨 Visual Signals
Entry Signals:
🟢 Green Triangle (below candle) = BUY LONG signal
🔴 Red Triangle (above candle) = SELL SHORT signal
Exit Signals:
🟣 Purple Label = Position closed (shows "x2", "x3" if multiple entries)
Additional Indicators:
💎 Aqua Diamond = Bullish divergence detected
💎 Fuchsia Diamond = Bearish divergence detected
🔵 Blue Background = NY Session active
🟡 Yellow Bar Tint = Volume spike detected
⚪ Small Circles = Near-signal conditions (2+ indicators aligned)
Live Counter:
Top corner shows: "Bull: X/4" and "Bear: X/4"
Indicates how many indicators currently align
⚙️ How to Use This Strategy
For Beginners (More Signals):
Set "Min Indicators Aligned" to 2
Turn OFF "Require Divergence"
Turn OFF "Require Volume Spike"
Turn OFF "Require Reversal Candle Pattern"
Keep "Allow Multiple Entries" OFF
This gives you more frequent signals to learn from.
For Advanced Traders (High Probability):
Set "Min Indicators Aligned" to 3 or 4
Turn ON "Require Divergence"
Turn ON "Require Volume Spike"
Turn ON "Require Reversal Candle Pattern"
Adjust stop loss to your risk tolerance
This filters for only the highest-quality setups.
Recommended Settings for 1-Hour Charts:
Min Indicators Aligned: 3
Stop Loss: 2.5%
Take Profit: 5.0%
RSI Length: 14
Williams %R Length: 14
Volume Multiplier: 1.5x
Session: NY only (for stocks)
BUY SIGNAL generated when:
2-4 indicators show oversold/bullish conditions:
RSI < 30 and turning up
MACD crossing bullish or histogram positive
Williams %R < -80 and turning up
Price at/below lower Bollinger Band
Optional confirmations (if enabled):
Bullish divergence detected
Volume spike present
Bullish reversal candle pattern
Session filter: Signals only during NY trading hours
SELL SIGNAL Generated When:
2-4 indicators show overbought/bearish conditions:
RSI > 70 and turning down
MACD crossing bearish or histogram negative
Williams %R > -20 and turning down
Price at/above upper Bollinger Band
Optional confirmations (if enabled):
Bearish divergence detected
Volume spike present
Bearish reversal candle pattern
🛡️ Risk Management Features
Automatic Stop Loss: Protects capital (default 2.5%)
Take Profit Target: Locks in gains (default 5.0%)
Pyramiding Control: Toggle to prevent position stacking
Session Filter: Avoids overnight risk and low-liquidity periods
Position Flipping: Automatically reverses when opposite signal appears
💡 Best Practices
✅ DO:
Wait for candle close before entering (built into strategy)
Use on volatile assets with clear trends
Combine with your own analysis and risk management
Backtest on your specific assets and timeframes
Start with paper trading to learn the signals
Adjust indicator requirements based on market conditions
❌ DON'T:
Use on very low timeframes (<5 min) without adjustment
Ignore the session filter on stocks
Use maximum leverage - these are reversal trades
Trade during major news events or earnings
Expect 100% win rate - focus on risk/reward ratio
📊 Performance Notes
This strategy prioritizes quality over quantity. With default settings, you may see:
2-5 signals per week on 1-hour charts
Higher win rate with stricter settings (3-4 indicators aligned)
Best performance during trending markets with clear reversals
Reduced performance in choppy, sideways markets
Tip: Adjust "Min Indicators Aligned" based on market conditions:
Trending markets: Use 3-4 (fewer but stronger signals)
Range-bound markets: Use 2 (more signals, but watch for false breakouts)

Trend Pullback System```{"variant":"standard","id":"36492","title":"Trend Pullback System Description"}
Trend Pullback System is a price-action trend continuation model that looks to enter on pullbacks, not breakouts. It’s designed to find high-quality long/short entries inside an already established trend, place the stop at meaningful structure, trail that stop as structure evolves, and warn you when the trade thesis is no longer valid.
Developed by: Mohammed Bedaiwi
---------------------------------
HOW IT WORKS
---------------------------------
1. Trend Detection
• The strategy defines overall bias using moving averages.
• Bullish environment (“uptrend”): price above the slower MA, fast MA above slow MA, and the slow MA is sloping up.
• Bearish environment (“downtrend”): price below the slower MA, fast MA below slow MA, and the slow MA is sloping down.
This prevents trading against chop and focuses on continuation moves in the dominant direction.
2. Pullback + Re-entry Logic
• The script waits for price to pull back into structure (support in an uptrend, resistance in a downtrend), and then push back in the direction of the main trend.
• That “push back” is the setup trigger. We don’t chase the first breakout candle — we buy/sell the retest + resume.
3. Structural Levels (“Diamonds”)
• Green diamond (below bar): bullish pivot low formed while the trend is bullish. This marks defended support.
- Use it as a re-entry zone for longs.
- Use it to trail a stop higher when you’re already long.
- Shorts can take profit here because buyers stepped in.
• Red diamond (above bar): bearish pivot high formed while the trend is bearish. This marks defended resistance.
- Use it as a re-entry zone for shorts.
- Use it to trail a stop lower when you’re already short.
- Longs can take profit here because sellers stepped in.
4. Entry Signals
• BUY arrow (green triangle up under the candle, text like “BUY” / “BUY Zone”):
- LongSetup is true.
- Trend is bullish or turning bullish.
- Price just bounced off recent defended support (green diamond) and reclaimed short-term momentum.
Meaning: enter long here or cover/exit shorts.
• SELL arrow (red triangle down above the candle):
- ShortSetup is true.
- Trend is bearish or turning bearish.
- Price just rolled down from defended resistance (red diamond) and lost short-term momentum.
Meaning: enter short here or take profit on longs.
These are the primary trade entries. They are meant to be actionable.
5. Weak Setups (“W” in yellow)
• Yellow triangle with “W”:
- A possible long/short idea is trying to form, BUT the higher-timeframe confirmation is not fully there yet.
- Think of it as early pressure / early caution, not a full signal.
• You usually watch these areas rather than jumping in immediately.
6. Exit Warning (orange “EXIT” label above a bar)
• The strategy will raise an EXIT marker when you’re in a trade and the *opposite* side just produced a confirmed setup.
- You’re short and a valid longSetup appears → EXIT.
- You’re long and a valid shortSetup appears → EXIT.
• This is basically: “Close or reduce — the other side just took control.”
• It’s not just a trailing stop hit; it’s a regime flip warning.
7. Stop, Target, and Trailing
• On every new setup, the script records:
- Initial stop: recent swing beyond the defended level (below support for longs, above resistance for shorts).
- Initial target: recent opposing swing.
• While you’re in position, if new confirming diamonds print in your favor, the stop can trail toward the new defended level.
• This creates structure-based risk management (not just fixed % or ATR).
8. Reference Levels
• The strategy also plots prior higher-timeframe closes (last week’s close, last month’s close, last year’s close). These can behave as magnets or stall points.
• They’re helpful for take-profit timing and for reading “are we trading above or below last month’s close?”
9. Momentum Panel (hidden by default)
• Internally, the script calculates an SMI-style momentum oscillator with overbought/oversold zones.
• This is optional visual confirmation and does not drive the core entry/exit logic.
---------------------------------
WHAT A TRADE LOOKS LIKE IN REAL PRICE ACTION
---------------------------------
Early warning
• Yellow W + red diamonds + red down arrows = “This is getting weak. Short setups are here.”
• You may also see something like “My Short Entry Id.” That’s where the short side actually engages.
Bearish follow-through, then exhaustion
• Price bleeds down.
• Then the orange EXIT appears.
→ Translation: “If you’re still short, close it. Buyers are stepping in hard. Risk of reversal is now high.”
Regime flip
• Right after EXIT, multiple green BUY arrows fire together (“BUY”, “BUYZone”).
• That’s the true long trigger.
→ This is where you either enter long or flip from short to long.
Expansion leg
• After that flip, price rips up for multiple candles / days / weeks.
• While it runs:
- Green diamonds appear under pullbacks → “dip buy zones / trail stop up here.”
- More BUY arrows show on minor pullbacks → continuation long / scale adds.
Distribution / topping
• Later, you start seeing new yellow W triangles again near local highs. That’s your “careful, this might be topping” warning.
• You finally get a hard red candle, and green diamonds stop stacking.
→ That’s where you tighten risk, scale out, or assume the move is mature.
In plain terms, the model is doing the following for you:
• It puts you short during weakness.
• It tells you when to get OUT of the short.
• It flips you long right as control changes.
• It gives you a structure-based trail the whole way up.
• It warns you again when momentum at the top starts cracking.
That is exactly how the logic was designed.
---------------------------------
QUICK INTERPRETATION CHEAT SHEET
---------------------------------
🔻 Red triangle + “Short Entry” near a red diamond
→ Short entry zone (or take profit on a long).
🟥 Red diamond above bar
→ Sellers defended here. Treat it as resistance. Good place to trail short stops just above that level. Avoid chasing longs straight into it.
🟨 Yellow W
→ Attention only. Early pressure / possible turn. Not fully confirmed.
🟧 EXIT (orange label)
→ The opposite side just printed a real setup. Close the old idea (cover shorts if you’re short, exit longs if you’re long). Thesis invalid.
🟩 Burst of green BUY triangles after EXIT
→ Long entry. Also a “cover shorts now” alert. This is the core money entry in bullish reversals.
💎 Green diamond below bar
→ Bulls defended that level. Good for trailing your long stop up, and good “buy the dip in trend” locations.
📈 Blue / teal MAs stacked and rising
→ Confirmed bullish structure. You’re in trend continuation mode, so dips are opportunities, not automatic exits.
---------------------------------
COLOR / SHAPE KEY
---------------------------------
• Green triangle up (“BUY”, “BUY Zone”):
Long entry / cover shorts / continuation long trigger.
• Red triangle down:
Short entry / take profit on longs / continuation short trigger.
• Orange “EXIT” label:
Opposite side just fired a real setup. The previous trade thesis is now invalid.
• Green diamond below price:
Bullish defended support in an uptrend. Use for dip buys, trailing stops on longs, and objective cover zones for shorts.
• Red diamond above price:
Bearish defended resistance in a downtrend. Use for re-entry shorts, trailing stops on shorts, and objective scale-out zones for longs.
• Yellow “W”:
Weak / early potential setup. Watch it, don’t blindly trust it.
• Moving average bands (fast MA, slow MA, Hull MA):
When stacked and rising, bullish control. When stacked and falling, bearish control.
---------------------------------
INTENT
---------------------------------
This system is built to:
• Trade with momentum, not against it.
• Enter on pullbacks into proven structure, not chase stretched breakouts.
• Automate stop/target logic around actual defended swing levels.
• Warn you when the other side takes over so you don’t give back gains.
Typical usage:
1. In an uptrend, wait for price to pull back, print a green diamond (support proved), then take the first BUY arrow that fires.
2. In a downtrend, wait for a bounce into resistance, print a red diamond (sellers proved), then take the first SELL arrow that fires.
3. Respect EXIT when it appears — that’s the model saying “this trade is done.”
---------------------------------
DISCLAIMER
---------------------------------
This script is for educational and research purposes only. It is not financial advice, investment advice, or a recommendation to buy or sell any security, cryptoasset, or derivative. Markets carry risk. Past performance does not guarantee future results. You are fully responsible for your own decisions, position sizing, risk management, and compliance with all applicable laws and regulations.

[Aegis]DCA grid Strategy for Crypto### **Crypto Market Long-Only Strategy (DCA with Risk Mitigation)**
This strategy is a Long-only approach, often using a Dollar-Cost Averaging (DCA) method for staggered entries. It is designed to mitigate the risk of being unable to exit a position for a prolonged period, which typically occurs when a series of initial DCA entries result in a losing trade.
The strategy has the following characteristics:
#### **1. Markets**
* Trade in highly liquid Perpetual Futures markets for cryptocurrencies.
#### **2. Position Sizing**
The initial entry quantity is determined by setting the **Initial Entry Ratio** in the input values.
* If the **Subsequent Entry Multiplier** is 1, the maximum position size upon final entry is determined by:
$$\text{Initial Entry Quantity} \times \text{Number of Entries}$$
* If the **Subsequent Entry Multiplier** is $x$, the maximum position size is determined by the following cumulative sum:
$$\text{1st Entry Quantity} + (\text{1st Entry Quantity} \times x) + (\text{2nd Entry Quantity} \times x) + \dots + ((\text{n-1)th Entry Quantity} \times x)$$
#### **3. Entries**
* The **1st Entry** is determined by the **Entry Sensitivity**. The first entry is automatically calculated based on an oversold condition; setting a higher sensitivity value will trigger the 1st entry in a more significant oversold situation.
* Entries from the **2nd Entry onwards** are made sequentially based on the generated **Grid Spacing**.
* The **Grid Spacing** is calculated as an equal interval:
$$\text{Grid Spacing} = \frac{\text{Final Entry Distance}}{(\text{Number of Entries} - 1)}$$
#### **4. Exits**
This strategy **does not distinguish between Stop-Loss and Take-Profit**. All entered quantities are liquidated simultaneously upon mean reversion. This transaction may result in either a loss or a profit. Generally:
* If the price recovery is rapid, the trade finishes with a profit.
* If the price recovery is slow, the trade finishes with a loss.
Therefore, the **'resilience' or 'recovery speed'** of the underlying asset significantly influences the long-term performance of the strategy.
크립토 시장에 특화된 Long only전략입니다. DCA 방식의 분할 매수 전략이 대체로 이익 거래가 아닌 경우, 장기간 탈출하지 못할 리스크를 보완한 전략입니다.
이 전략은 다음과 같은 특징을 가지고 있습니다.
##### 1. 시장 (Markets)
• 유동성이 풍부한 코인 무기한 선물 시장에서 거래한다.
##### 2. 포지션 크기 (Position Sizing)
인풋 값에 최초진입비율을 설정함으로써 1차 진입의 수량이 결정됩니다.
- 추가 진입배수가 1일 때, 최대 진입 시 포지션 크기는 "1차 진입수량 * 진입횟수"에 의해 결정됩니다.
- 추가 진입배수가 x일때,
1차진입물량 + (1차진입 물량 * x) + (2차진입 물량 * x) ..... + (n-1)차 진입물량 * x 의 방식으로 최대 진입 시 포지션 크기가 결정 됩니다
##### 3. 진입 (Entries)
- 1차 진입은 진입 둔감도에 의해 결정됩니다. 1차 진입은 과매도 상황을 자동적으로 계산하여 결정되며, 둔감도를 높은 값으로 설정하면 더 큰 과매도 상황에서 1차 진입이 결정됩니다.
- 2차 이후의 진입은 생성된 그리드 간격에 의해 순차적으로 진입하게 됩니다.
- 그리드 간격은 최종 진입 간격 / (진입 횟수 - 1) 으로 등간격으로 이루어집니다.
##### 4. 청산 (Exits)
이 전략은 손절과 익절을 구분하지 않습니다. 평균 회귀를 하는 경우 진입한 모든 물량을 일시에 청산하며, 이 거래는 손실 거래일 수도, 이익 거래일 수도 있습니다. 일반적으로, 가격 회복이 빠르게 되는 경우 이익 거래로 마무리되고, 가격 회복이 느린 경우 손실 거래로 마무리되기 때문에, 장기적으로 종목의 '회복탄력성'이 전략의 성과에 영향을 줄 수 있습니다.

[Aegis]Original Turtle System for CryptoAs Richard Dennis once said, "Even if I published all the Turtle rules in the newspaper right now, no one would be able to 'execute' them," and 40 years later, even in modern financial markets (like the crypto market) where all the conditions have been disclosed, this strategy continues to deliver amazing performance. The following outlines the original Turtle rules as disclosed by Curtis Faith in his book *Way of the Turtle*, and a TradingView algorithm that translates these rules for application in the crypto market.
---
### **The Original Turtle Trading Rules**
#### **1. Markets**
* Trade in liquid futures markets.
#### **2. Position Sizing**
The volatility measure, **N**, is used as the basis for all calculations.
**True Range (TR) Calculation:** Select the largest of the following three values:
* Current High - Current Low
* $|\text{Current High} - \text{Previous Close}|$ (Absolute Value)
* $|\text{Current Low} - \text{Previous Close}|$ (Absolute Value)
**N (Average True Range, ATR) Calculation:**
$$N = \frac{(19 \times \text{PDN} + \text{TR})}{20}$$
* **PDN:** Previous Day's N value
* **TR:** Current True Range
This is similar to a 20-day Exponential Moving Average, and is sometimes calculated using a Simple Moving Average.
**Unit Size Calculation:**
$$\text{Unit Size (Number of Contracts)} = \frac{1\% \text{ of Account Equity}}{(\text{N} \times \text{Dollars per Point})}$$
* **Dollars per Point (Tick Value):** The value of a 1-point change in price.
#### **3. Entries**
* **Entry:** Buy when the 55-day high is broken to the upside, and sell when the 55-day low is broken to the downside.
#### **5. Stops**
* The stop-loss for every unit is set at a price **2N** unfavorable from the entry price.
* For each additional unit added, the stop price for the **entire position** is adjusted favorably by **1/2 N**.
* In other words, the stop price of the last unit entered becomes the stop price for the entire position.
#### **6. Exits**
The exit rule for profitable positions (before a stop is hit) is as follows:
* **Long Positions:** Exit when the 20-day low is broken to the downside.
* **Short Positions:** Exit when the 20-day high is broken to the upside.
*Note: This exit rule is followed only if the price has moved up by a value greater than or equal to the N value multiplied by the criterion for changing the take-profit line (the original Korean text mentions a condition based on N, which is commonly interpreted as requiring a profit before applying the channel exit).*
리처드 데니스가 앞서 "내가 지금 당장 터틀의 모든 규칙을 신문에 공표한다고 해도 아무도 '실행'하지 못할 것"라고 말했듯 40년이 흘러 모든 조건이 공개된 현대 금융시장(크립토 시장)에서도 여전히 이 전략은 놀라운 퍼포먼스를 기록하고 있습니다. 아래는 커티스 페이스가 자신의 저서 '터틀의 방식'에 공개한 오리지널 터틀 규칙과 이를 알고리즘으로 변환하여 크립토마켓에 적용한 트레이딩뷰 알고리즘 입니다.
##### 1. 시장 (Markets)
• 유동성이 풍부한 선물 시장에서 거래한다.
##### 2. 포지션 크기 (Position Sizing)
변동성 측정 단위인 N을 모든 계산의 기초로 사용한다.
**True Range (TR) 계산:** 다음 세 가지 값 중 가장 큰 값을 선택한다.
- • 현재 고가 - 현재 저가
- • |현재 고가 - 전일 종가| (절대값)
- • |현재 저가 - 전일 종가| (절대값)
**N (Average True Range, ATR) 계산:**
N = (19 × PDN + TR) / 20
- • PDN: 이전 날의 N 값
- • TR: 현재 True Range
이는 20일 지수이동평균과 유사하며, 단순이동평균으로 계산하기도 한다.
**1 유닛(Unit)의 크기 계산:**
유닛 크기 (계약 수) = 계좌 자산의 1% / (N × 틱 가치)
• 틱 가치(Dollars per Point): 1포인트 변동 시의 가치
##### 3. 진입 (Entries)
- • 진입: 55일 고가를 상향 돌파하면 매수, 55일 저가를 하향 돌파하면 매도한다.
##### 5. 손절 (Stops)
- • 모든 유닛에 대한 손절 기준은 진입 가격으로부터 2N 만큼 불리한 가격에 설정한다.
- • 유닛이 추가될 때마다 전체 포지션의 손절 가격을 1/2 N 만큼 유리한 방향으로 상향 조정한다.
- • 즉, 마지막으로 진입한 유닛의 손절 가격이 전체 포지션의 손절 가격이 된다.
##### 6. 청산 (Exits)
손절에 도달하기 전 수익 중인 포지션의 청산 규칙은 다음과 같다.
- • 매수 포지션: 20일 저가를 하향 돌파할 때 청산한다.
- • 매도 포지션: 20일 고가를 상향 돌파할 때 청산한다.
단, N값에 익절선 변경 기준을 곱한 값 이상으로 가격이 상승할 경우, 위 규칙을 따른다.

VWAP Retest + EMA9 Cross + Candle Pattern V2📈 VWAP Retest + EMA9 Cross + Candle Pattern Strategy_V2
Setup: This intraday momentum strategy combines 3 core elements:
• VWAP Retest: Price retests VWAP within a small buffer zone
• EMA9 Crossover: EMA9 crosses above VWAP within the last 3 bars
• Bullish Candle Pattern: At least one bullish signal — Hammer, Engulfing, or Momentum candle
A trade is triggered only during the US morning session (9:30–12:30 EST) and only if price is above yesterday’s high, suggesting strong momentum.
⚙️ Strategy Settings
• Initial Capital: $100,000
• Position Sizing: 10% of equity per trade
• Commission: 0.03% per trade
• Slippage: 1 tick
• Take Profit: +3% from entry
• Stop Loss: 0.5% below VWAP at entry
• Forced Exit: 1:00 PM EST
📊 Strategy Logic
• VWAP Retest Filter ensures entry is near a value zone.
• EMA9 Cross Confirmation aligns short-term momentum with volume-weighted price.
• Bullish Candle Patterns provide price action confirmation:
○ ✅ Hammer
○ ✅ Bullish Engulfing
○ ✅ Large momentum body
• Above Yesterday’s High (YH) acts as a bullish bias filter.
🧪 Backtest Results (Jan 2023 – Oct 2025)
• Total Trades: 120
• Win Rate: 52.5%
• Profit Factor: 1.18
• Max Drawdown: 1.22%
• Net P&L: +$1,064 (+1.06%)
Due to chart data limits, only part of the period may be visible on publication charts.
🔍 Chart Visuals
This strategy plots:
• VWAP (white) and EMA9 (orange)
• Candle pattern markers:
○ “H” = Hammer
○ “BE” = Bullish Engulfing
○ “M” = Momentum Candle
• “SETUP” label when all conditions are met
• YH/YL labels for context — previous day’s high/low
💡 Use Case
This setup is designed for intraday momentum scalping, ideal for traders who:
• Trade morning breakouts
• Use VWAP as a dynamic support/resistance
• Want clear, rule-based entries based on both trend and price action
Educational and research use - not financial advice.

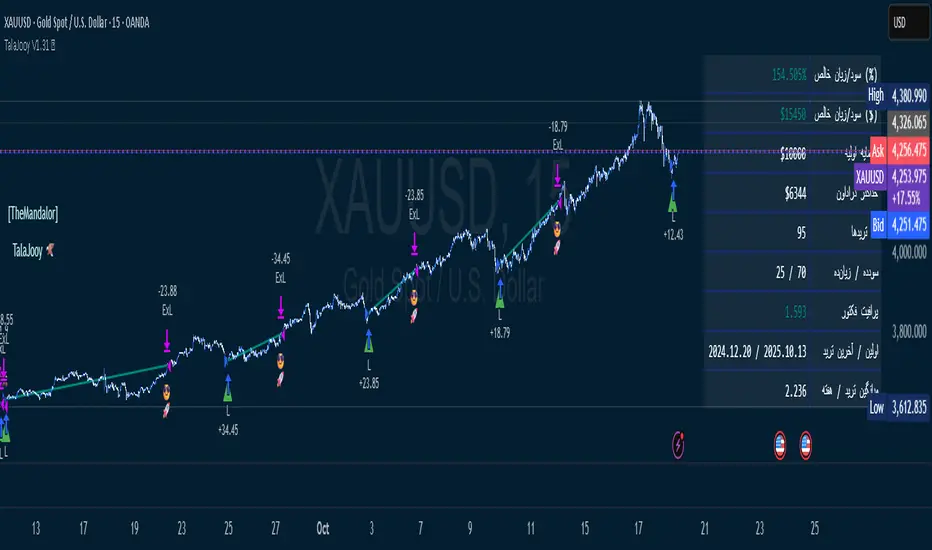
TalaJooy V1.31 𓅂💎 استراتژی معاملاتی TalaJooy V1.31 𓅂
TalaJooy (طلاجوی) یک چارچوب معاملاتی حرفهای و کامل برای TradingView است که برای حذف حدس و گمان، احساسات و تصمیمگیریهای هیجانی از فرآیند معاملات طراحی شده است.
این محصول یک «اندیکاتور سیگنالدهی» ساده نیست؛ بلکه یک استراتژی (Strategy) کامل است که چهار وظیفه کلیدی را به صورت خودکار انجام میدهد:
تحلیل بازار (بر اساس یک موتور امتیازدهی کمی)
صدور سیگنال (ورود و خروج شفاف)
مدیریت ریسک پویا (محاسبه خودکار حد ضرر)
مدیریت حجم پوزیشن (محاسبه خودکار حجم بر اساس ریسک)
هدف «طلاجوی» تبدیل معاملهگری شهودی به یک فرآیند مکانیکی، مبتنی بر داده و مدیریت ریسک است.
⚙️ قابلیتهای کلیدی (آنچه دریافت میکنید)
این استراتژی مجهز به مجموعهای از ابزارهای حرفهای است که مستقیماً روی چارت شما اجرا میشوند:
🎯 ۱. سیگنالهای ورود و خروج شفاف
فلشهای واضح خرید (▲) و فروش (▼) که نقاط دقیق ورود بر اساس منطق استراتژی را مشخص میکنند. این سیستم تنها زمانی سیگنال صادر میکند که فیلترهای روند، همسویی لازم را تایید کنند.
🛡️ ۲. مدیریت ریسک پویای ATR
بزرگترین چالش معاملهگران، تعیین حد ضرر (SL) مناسب است. این استراتژی حد ضرر را به صورت خودکار و پویا بر اساس نوسانات واقعی بازار (با استفاده از ATR) محاسبه میکند.
نتیجه: در بازارهای پرنوسان، استاپ شما برای جلوگیری از استاپهانت شدن، فاصله ایمنتری میگیرد و در بازارهای آرام، بهینهتر و نزدیکتر تنظیم میشود.
💰 ۳. محاسبه خودکار حجم پوزیشن
دیگر نیازی به «ماشین حساب پوزیشن» ندارید. استراتژی به صورت اتوماتیک، حجم دقیق هر معامله را بر اساس درصد ریسک ثابتی که شما از کل سرمایهتان تعیین میکنید، محاسبه مینماید. این ویژگی، مدیریت سرمایه حرفهای را در تمام معاملات شما تضمین میکند.
🎨 ۴. نواحی بصری سود و زیان (TP/SL)
هنگامی که یک معامله باز است، این ابزار به صورت زنده، نواحی حد سود (سبز) و حد ضرر (قرمز) را مشابه ابزار پوزیشن خود تریدینگ ویو، مستقیماً روی چارت برای شما رسم میکند.
📈 ۵. پنل آمار عملکرد پیشرفته
یک جدول آماری جامع که تمام معیارهای کلیدی عملکرد شما را به صورت زنده نمایش میدهد:
سود و زیان خالص (دلاری و درصدی)
ضریب سود (Profit Factor)
نرخ موفقیت (Win Rate)
تعداد معاملات سودده / زیانده
حداکثر افت سرمایه (Max Drawdown)
و موارد دیگر...
🚦 ۶. آیکونهای بازخورد معامله
با آیکونهای هوشمند، فوراً کیفیت معاملات بسته شده خود را ارزیابی کنید:
😎🚀 (سود ویژه و قابل توجه)
💰 (سود عادی)
🙈 (زیان)
📈 چگونه از این ابزار استفاده کنید؟
«طلاجوی» یک 'ماشین چاپ پول' جادویی نیست، بلکه یک ابزار تست و اجرای حرفهای است.
۱. بکتست و بهینهسازی (Backtesting)
مهمترین قدرت این اسکریپت، قابلیت Strategy بودن آن است. شما میتوانید این استراتژی را روی هر جفتارز و تایم فریمی که معامله میکنید (طلا، کریپتو، جفتارزها و...) بکتست بگیرید تا آمار عملکرد آن را مشاهده کنید.
۲. تنظیم پارامترها
از طریق منوی تنظیمات، پارامترهای کلیدی مانند درصد ریسک، نسبت ریسک به ریوارد (R:R)، و فیلترهای زمانی را مطابق با سبک معاملاتی و دارایی مورد نظر خود بهینهسازی کنید.
۳. اجرای سیستماتیک
پس از یافتن تنظیمات بهینه در بکتست، در معاملات زنده به سیگنالها پایبند بمانید و اجازه دهید منطق مکانیکی، معاملات شما را مدیریت کند.
⚠️ سلب مسئولیت مهم (مطابق با قوانین TradingView)
این اسکریپت صرفاً یک ابزار تحلیلی و معاملاتی است و نباید به عنوان سیگنال مالی یا توصیهای برای خرید و فروش تلقی شود. تمام معاملات دارای ریسک هستند و نتایج گذشته تضمینکننده عملکرد آینده نمیباشد.
لطفاً قبل از استفاده از این استراتژی در حساب واقعی، آن را به طور کامل در حالت دمو یا بکتست ارزیابی کنید. مسئولیت تمامی سودها و زیانها بر عهده خود معاملهگر است.
💎 TalaJooy V1.31 𓅂 Trading Strategy
TalaJooy (meaning "Gold Seeker") is a complete, professional trading framework for TradingView, designed to remove guesswork, emotion, and impulsive decisions from your trading process.
This is not a simple signal indicator; it is a complete Strategy script that automates four key tasks:
Market Analysis (Based on a quantitative scoring engine)
Signal Generation (Clear entries and exits)
Dynamic Risk Management (Automated Stop Loss calculation)
Position Sizing (Automated trade sizing based on risk)
The goal of "TalaJooy" is to transform intuitive trading into a mechanical, data-driven, and risk-managed process.
⚙️ Key Features (What You Get)
This strategy comes equipped with a suite of professional tools that run directly on your chart:
🎯 1. Clear Entry & Exit Signals
Receive unambiguous Buy (▲) and Sell (▼) arrows identifying precise entry points based on the strategy's logic. The system only generates signals when its trend-confirmation filters are aligned.
🛡️ 2. Dynamic ATR Risk Management
A trader's biggest challenge is setting a proper Stop Loss (SL). This strategy calculates your SL automatically and dynamically based on real-time market volatility (using ATR).
The Benefit: In volatile markets, your stop is placed at a safer distance to avoid being "stopped out" by noise. In calm markets, it's set tighter and more efficiently.
💰 3. Automated Position Sizing
Stop using external "position size calculators." The strategy automatically calculates the exact trade size for every position based on a fixed risk percentage of your total equity (which you define). This enforces professional money management on every trade.
🎨 4. Visual Profit & Loss (TP/SL) Zones
While a trade is active, this tool plots live, visual zones for your Take Profit (green) and Stop Loss (red) targets, similar to TradingView's native "Long/Short Position" tool.
📈 5. Advanced Performance Stats Panel
A comprehensive statistics table displays all your key performance metrics in real-time:
Net Profit (% and $)
Profit Factor
Win Rate
Win / Loss Trade Count
Max Drawdown
And more...
🚦 6. Smart Trade Feedback Icons
Instantly review the quality of your closed trades with intelligent emoji feedback:
😎🚀 (Exceptional Profit)
💰 (Standard Profit)
🙈 (Loss)
📈 How to Use This Tool
"TalaJooy" is not a "magic money machine"; it is a professional-grade tool for testing and execution.
1. Backtesting & Optimization
The most powerful feature of this script is its Strategy component. You can backtest it on any asset or timeframe you trade (Gold, Crypto, Forex, etc.) to see its historical performance data.
2. Parameter Tuning
Use the settings menu to optimize key parameters—such as Risk Percentage, Risk:Reward Ratio, and core filter settings—to match your personal trading style and preferred assets.
3. Systematic Execution
After identifying optimal settings via backtesting, adhere to the signals in your live trading and let the mechanical logic manage your trades.
⚠️ Important Disclaimer (TradingView Compliant)
This script is provided for educational and analytical purposes only. It is not financial advice or a recommendation to buy or sell any asset. All trading involves substantial risk. Past performance is not indicative of future results.
Please thoroughly evaluate this strategy via backtesting or paper trading before deploying it with real funds. The user assumes full responsibility for all profits and losses incurred.
USDJPY MA Zone Entry Strategy USD/JPY tested only.A consistent strategy that gives me alerts each time my conditions are met. I am a funded prop firm trader. this strategy gives 45-70% annual returns. the sequence for this strategy is: After 4 stop loss hits, place a trade on the NEXT ENTRY ALERT ONCE: (-.188) pips draw back towards the stop loss. (this turns the Strat from 1-3 RISK/REWARD to 1-7+ RISK/REWARD). keep the Stop Loss the same (-.300) away from your entry. Take Profit placed at (+1.488) from entry. if 3 losses in a row happens AFTER you've followed these instructions, don't trade again UNTIL the strategy has a TAKE PROFIT gain, then the sequence starts over again. that is this strategies losing streak. after that streak is over. the strategy will be back to give you profits.

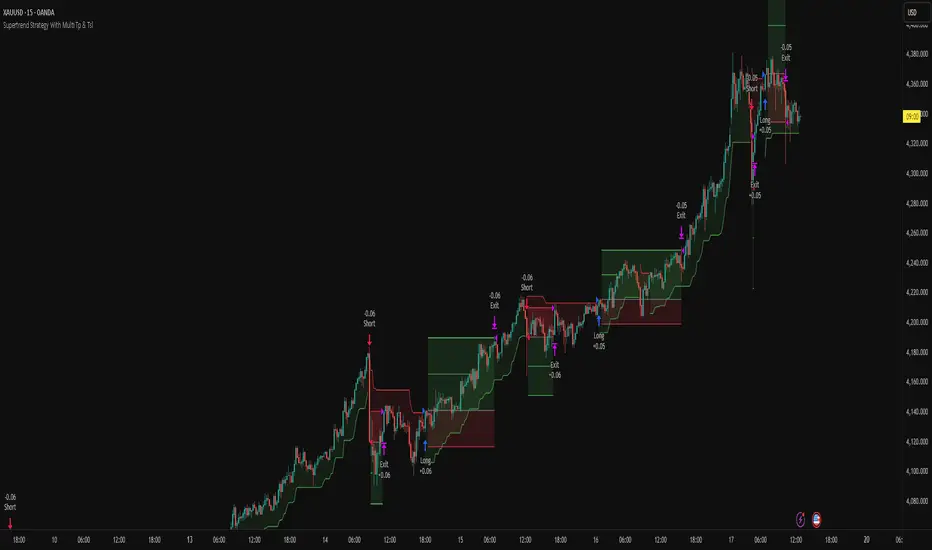
Supertrend Strategy With Multi Tp & TslHello Traders,
This strategy is based on the popular Supertrend indicator, which many traders use as a simple trend-following tool. The core entry logic is straightforward:
Buy (Long) when the price closes above the Supertrend line.
Sell (Short) when the price closes below the Supertrend line.
However, trading success isn’t only about entries — proper risk management makes all the difference. That’s why this strategy includes four stop-loss methods, two take-profit types, and a trailing stop-loss system. You can customize all of these settings to create your own personalized version.
🛑 Stop-Loss Methods
Tick – Uses the instrument’s smallest price increment. Ideal for tick-based markets such as Futures or Forex.
Percent – Defines the stop-loss as a percentage of entry price. Commonly used in Crypto trading.
ATR – Uses the Average True Range value to determine stop-loss distance. Perfect for adapting to changing market volatility.
Supertrend – The stop-loss level is set at the Supertrend line value at the time of entry.
🔁 Trailing Stop-Loss & Reverse Signals
Trailing SL: If enabled, the chosen stop-loss method will trail the price dynamically from the moment the position opens.
Close with Reverse Signals: When activated, the current position closes and reverses on an opposite signal. If disabled, the strategy waits until the current position is closed before opening a new one.
🎯 Take-Profit Options
Tick – Set a fixed take-profit level based on tick distance.
Percent – Set take-profit based on a percentage change from entry.
Ratio – Sets take-profit based on the entry-to-stop-loss distance × ratio value.
Each take-profit method allows you to define the percentage of position to close at that level.
⚖️ Breakeven Option
When Breakeven is enabled, after the first take-profit is triggered, the stop-loss automatically moves to the entry level, protecting your capital.
⚙️ Additional Settings
Position Type: Choose between Long only, Short only, or Both directions.
Session Filter: Trade only during specific time ranges. Activate this option and set your desired session hours (make sure to select your correct timezone).
📈 Visuals
The strategy plots entry, stop-loss, and take-profit levels directly on the chart, allowing you to clearly visualize your trades and manage them effectively.
Feel free to ask any questions or suggest improvements — this strategy is built for flexibility and experimentation!
MTF MACD + Accelerator Oscillator Strategy ※日本語説明は英文の下にあります。
Concept:
This is a multi-timeframe trend-following strategy that combines:
Higher timeframe MACD → determines the major trend direction.
Lower timeframe Accelerator Oscillator (AC) → identifies acceleration in momentum for optimal entry timing.
The strategy enters trades in the direction of the higher timeframe trend when the AC shows a momentum acceleration.
Entry Rules:
Long (Buy):
Higher timeframe MACD line > signal line (uptrend)
AC crosses above zero line on the lower timeframe
Short (Sell):
Higher timeframe MACD line < signal line (downtrend)
AC crosses below zero line on the lower timeframe
Exit Rules:
Take Profit: ATR(14) * 1.5 (configurable)
Stop Loss: ATR(14) * 1.0 (configurable)
Exit on opposite signal or if TP/SL is hit
Plotting:
AC is plotted on the chart (green for positive, red for negative)
Buy/Sell signals are marked with small triangles below/above bars
Customization:
Timeframe, MACD parameters, ATR multipliers can be adjusted in the input settings.
Works for scalping, day trading, or swing trading on various instruments.
---------------------------------------------------------------------
コンセプト:
この戦略はマルチタイムフレームのトレンドフォロー型で、以下を組み合わせています:
上位足MACD → 大きなトレンド方向を確認
下位足Accelerator Oscillator(AC) → モメンタム加速のタイミングを捉え、最適なエントリーを判断
上位足のトレンド方向に沿って、下位足でACが勢いの加速を示したタイミングでエントリーします。
エントリールール:
ロング(買い):
上位足MACDライン > シグナルライン(上昇トレンド)
下位足ACが0ラインを上抜け
ショート(売り):
上位足MACDライン < シグナルライン(下降トレンド)
下位足ACが0ラインを下抜け
エグジットルール:
利確:ATR(14) * 1.5(設定可能)
損切り:ATR(14) * 1.0(設定可能)
逆シグナル発生時やTP/SL到達時にも決済
チャート表示:
ACはチャート上にプロット(正なら緑、負なら赤)
買い/売りシグナルはバーの下/上に小さな三角で表示
カスタマイズ:
時間足、MACDパラメータ、ATR倍率は入力設定で変更可能
スキャルピング、デイトレード、スイングトレードなど幅広く利用可能

Turtle Strategy - Triple EMA Trend with ADX and ATRDescription
The Triple EMA Trend strategy is a directional momentum system built on the alignment of three exponential moving averages and a strong ADX confirmation filter. It is designed to capture established trends while maintaining disciplined risk management through ATR-based stops and targets.
Core Logic
The system activates only under high-trend conditions, defined by the Average Directional Index (ADX) exceeding a configurable threshold (default: 43).
A bullish setup occurs when the short-term EMA is above the mid-term EMA, which in turn is above the long-term EMA, and price trades above the fastest EMA.
A bearish setup is the mirror condition.
Execution Rules
Entry:
• Long when ADX confirms trend strength and EMA alignment is bullish.
• Short when ADX confirms trend strength and EMA alignment is bearish.
Exit:
• Stop Loss: 1.8 × ATR below (for longs) or above (for shorts) the entry price.
• Take Profit: 3.3 × ATR in the direction of the trade.
Both parameters are configurable.
Additional Features
• Start/end date inputs for controlled backtesting.
• Selective activation of long or short trades.
• Built-in commission and position sizing (percent of equity).
• Full visual representation of EMAs, ADX, stop-loss, and target levels.
This strategy emphasizes clean trend participation, strict entry qualification, and consistent reward-to-risk structure. Ideal for swing or medium-term testing across trending assets.

Moon Phases Long/Short StrategyThis is an experiment of Moon Phases, likely buy when full moon and sell when new moon with few changes, like it would buy a day ahead or sometimes sell a day post these events, with Stop loss and take profits, 50% profitable so sounds good to me
Long only good for bitcoin gold, both modes(L+S) better for stocks and alt coins

Larry Williams Oops StrategyThis strategy is a modern take on Larry Williams’ classic Oops setup. It trades intraday while referencing daily bars to detect opening gaps and align entries with the prior day’s direction. Risk is managed with day-based stops, and—unlike the original—all positions are closed at the end of the session (or at the last bar’s close), not at a fixed profit target or the first profitable open.
Entry Rules
Long setup (bullish reversion): Today opens below yesterday’s low (down gap) and yesterday’s candle was bearish. Place a buy stop at yesterday’s low + Filter (ticks).
Short setup (bearish reversion): Today opens above yesterday’s high (up gap) and yesterday’s candle was bullish. Place a sell stop at yesterday’s high − Filter (ticks).
Longs are only taken on down-gap days; shorts only on up-gap days.
Protective Stop
If long, stop loss trails the current day’s low.
If short, stop loss trails the current day’s high.
Exit Logic
Positions are force-closed at the end of the session (in the last bar), ensuring no overnight exposure. There is no take-profit; only stop loss or end-of-day flat.
Notes
This strategy is designed for intraday charts (minutes/seconds) using daily data for gaps and prior-day direction.
Longs/shorts can be enabled or disabled independently.
